

Graphic area forecast (GFA) charts are issued four times daily, approximately 30 min before the beginning of the forecast period. The GFA is issued at approximately 2330, 0530, 1130 and 1730 UTC and is valid at 0000, 0600, 1200 and 1800 UTC respectively. Each issue of the GFA consists of six charts: two charts valid at the beginning of the forecast period; two charts valid six hours into the forecast period; and the final two charts valid twelve hours into the forecast period.
Speeds in the graphic area forecast (GFA) are expressed in knots and heights in hundreds of feet. Horizontal visibility is measured in statute miles and all times are stated in Coordinated Universal Time.
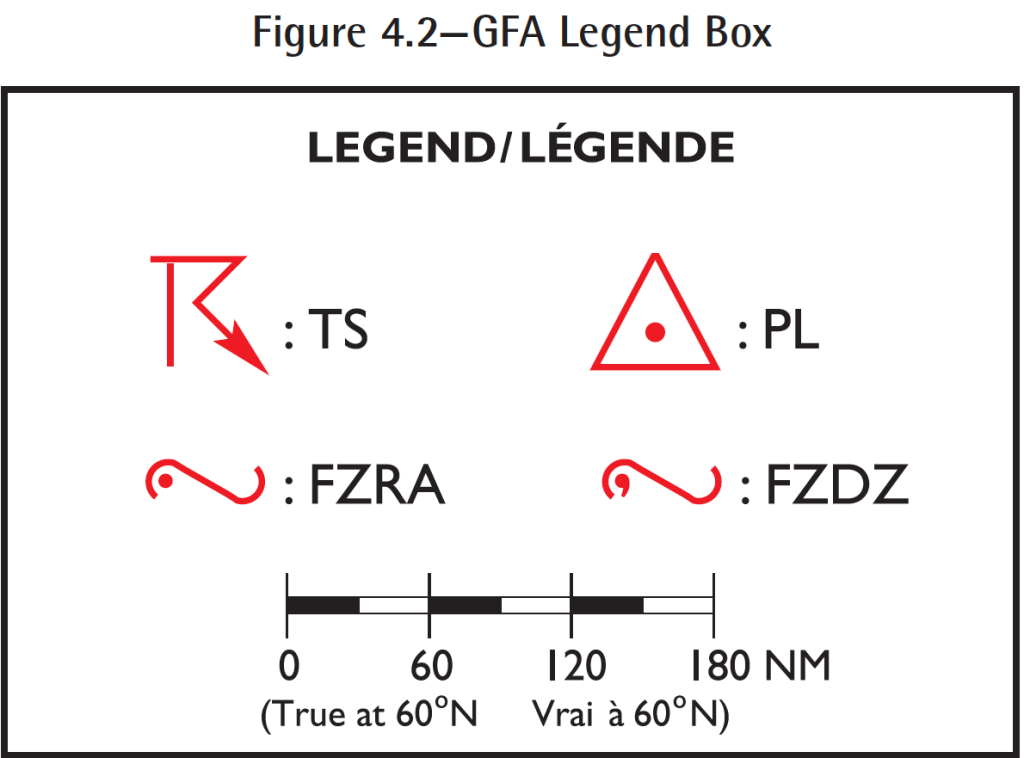
The legend box includes weather symbols that may be used in the weather information part of the graphic area forecast (GFA) chart. It also includes a nautical mile scale bar to facilitate the determination of distances. Symbols used in the GFA are consistent with those used in a significant weather prognostic chart. In the following example, symbols for thunderstorm (TS), ice pellets (PL), freezing rain (FZRA) and freezing drizzle (FZDZ) are indicated in the legend box. These symbols are depicted in red when shown in colour.
The comments box provides information that the weather forecaster considers important (e.g. formation or dissipation of fog, increasing or decreasing visibility). It is also used to describe elements that are difficult to render pictorially or, if added to the depiction, would cause the chart to become cluttered (e.g. light icing). The standard phrases “HGTS ASL UNLESS NOTED” and “CB TCU AND ACC IMPLY SIG TURBC AND ICG. CB IMPLIES LLWS” are also included in the comments box.

The IFR outlook is always general in nature, indicating the main areas where IFR weather is expected, the cause for the IFR weather and any associated weather hazards. In the example given, IFR conditions caused by low ceilings (CIG), rain (RA) and mist (BR) south of the St. Lawrence Valley are forecast. Also, local IFR conditions are forecast because of an onshore (ONSHR) and upslope (UPSLP) northwesterly flow of air from James Bay (JAMSBA) and Hudson’s Bay (HSNBA).

The graphic area forecast (GFA) clouds and weather chart provides a forecast of cloud layers and/or surface-based phenomena, visibility, weather and obstructions to vision at the valid time indicated. Lines joining points of equal surface pressure (isobars) are depicted at 4-hPa intervals. In addition, relevant synoptic features that are responsible for the portrayed weather are also depicted, with an indication of their speed and direction of movement at the valid time.
Synoptic features—The motion of synoptic features when the speed of movement is forecast to be 5 kt or more will be indicated by an arrow and a speed value. For speeds less than 5 kt, the letters QS (quasi-stationary) are used. A low-pressure centre moving eastward at 15 kt with an associated cold front moving southeast at 10 kt would be indicated as follows:

Clouds—The bases and tops of forecast clouds between the surface and 24 000 ft ASL will be indicated on the GFA clouds and weather chart. The tops of convective clouds (i.e. TCU, ACC, CB) are indicated, even if they extend above 24 000 ft ASL. Cirrus clouds are not depicted on the chart. The cloud type will be indicated if considered significant; however, convective clouds, such as CU, TCU, ACC and CB, will always be stated if forecast to be present. A scalloped border, depicted in brown when shown in colour, encloses organized areas of clouds where the sky condition is either broken (BKN) or overcast (OVC). An organized area of broken cumulus clouds based at 2 000 ft ASL with tops at 8 000 ft ASL would be indicated as follows:

Where organized areas of clouds are not forecast and visibility is expected to be greater than 6 SM, a scalloped border is not used. In these areas, the sky condition is stated using the terms SKC, FEW or SCT. In the following example, unorganized scattered clouds are forecast based at 3 000 ft ASL with tops at 5 000 ft ASL:

When a forecasted cloud deck contains more than one significant cloud layer, the cloud amount description depends on the space between the layers. When the separation is less than 2 000 ft, the descriptor represents the summation amount across all the layers, and the term LYRS is included immediately after it. When the separation is 2 000 ft or greater, each layer is stated, with its own descriptor that applies only to that layer. The bases and tops of each layer are indicated. For instance, a scattered layer of cumulus cloud based at 3 000 ft ASL with tops at 5 000 ft ASL and a higher overcast layer of cloud based at 10 000 ft ASL with tops at 13 000 ft ASL would be indicated as follows:

All heights are indicated in hundreds of feet above sea level (2 means 200 ft, 45 means 4 500 ft, etc.) unless otherwise specified. Above ground level heights are indicated by the abbreviations CIG and AGL (e.g. CIGS 5–10 AGL). A note to this effect is included in the comments box in the lower right hand corner of the chart.
The vertical visibility into surface-based layers is measured in hundreds of feet AGL. Local obscured ceilings with a vertical visibility of between 300 and 500 ft AGL would be indicated as follows:

The forecast visibility is measured in statute miles. When the visibility is expected to be greater than 6 SM, it is indicated as P6SM. A forecast visibility that is expected to vary between 2 and 4 SM with light rain showers would be indicated as:

Weather and obstructions to vision—Forecast weather is always included immediately after visibility. Obstructions to vision are only mentioned when visibility is forecast to be 6 SM or less (e.g. 2–4SM –RA BR). Only standard abbreviations are used to describe weather and obstructions to vision. Areas of showery or intermittent precipitation are shown as hatched areas enclosed by a dashed green line when colour is used. Areas of continuous precipitation are shown as stippled areas enclosed by a solid green line when colour is used. Areas of obstruction to vision not associated with precipitation, where visibility is 6 SM or less, are enclosed by a dashed orange line when colour is used. Areas of freezing precipitation are depicted in red and enclosed by a solid red line when colour is used.

Weather and obstructions to vision in the GFA may include spatial qualifiers, which describe the coverage of the depicted meteorological phenomena.


These lines joining points of equal mean sea level pressure are depicted on the GFA clouds and weather chart. Isobars are drawn at 4-hPa intervals from a reference value of 1 000 hPa.

The speed and direction of forecast surface winds with a sustained speed of at least 20 kt are indicated by wind barbs and an associated wind-speed value. When accompanied by strong gusts, mean sustained winds of less than 20 kt may also be included, at the forecaster’s discretion, if moderate mechanical turbulence is expected to occur as a result of the wind gusts. Wind gusts are indicated by the letter “G,” followed by the peak gust speed in knots. In the following example, the surface wind is forecast to be from the west (270˚ true) with a speed of 25 kt and a peak gust speed of 35 kt.

Depicted in blue when shown in colour and indicated whenever moderate or severe icing is forecast for the coverage area. The bases and tops of each icing layer, measured in hundreds of feet above mean sea level, as well as the type of icing (e.g. “RIME”, “MXD” [mixed], “CLR” [clear]) will be indicated. Areas of light icing are described in the comments box.

An area of moderate mixed icing based at 2 000 ft ASL with a top of 13 000 ft ASL would be indicated as follows:

If icing is expected to be present during only part of the forecast period covered by the chart, the time of occurrence of the icing is indicated in the comments box.
Areas of severe icing are indicated with a denser stippling. The following is an example of an area of severe icing contained within an area of moderate icing:

Depicted in red when shown in colour and indicated whenever moderate or severe turbulence is forecast for the coverage area. The base and top of each turbulence layer is measured in hundreds of feet above sea level except for surface-based turbulence, which is measured in feet above ground level. An abbreviation indicating the cause of the turbulence will be included. Turbulence due to mechanical turbulence, low-level wind shear, lee/mountain waves, a significant low-level jet or in clear air will be indicated as MECH, LLWS, LEE WV, LLJ or CAT, respectively. The following example indicates an area of moderate clear air turbulence (CAT) based at 18 000 ft ASL with a top at 26 000 ft ASL.

Severe turbulence is depicted with a higher density of hatching. The following example shows an area of severe turbulence surrounded by a larger area of moderate turbulence:

When separate areas of turbulence are occurring at different altitudes, the lower level is shown with hatching that slants upward to the right, while the higher level is depicted with hatching that slants downward to the right, as indicated below:

Freezing level contours are indicated on a GFA by dashed lines. The height of the freezing level is indicated to the nearest multiple of 2 500 ft using the standard heights in hundreds of feet above sea level (e.g. SFC, 25, 50, 75, 100, meaning surface, 2 500, 5 000, 7 500, 10 000). When more than one freezing level is forecast, only the lowest level needs to be indicated, unless meteorological conditions are expected to be relevant to aviation safety (e.g. freezing precipitation aloft). An above freezing layer (AFL) is indicated by a closed area as shown below:

Temporal changes in the freezing level, when significant, are indicated in the comments box of the chart, as in the following example:
FZLVL 20 LWRG TO SFC AFT 03Z
Low Level Jet (LLJ) included on the GFA icing, turbulence and freezing level chart when it is expected to have a peak core speed of 50 kt or more. It may be included at speeds between 35 and 45 kt when significant associated turbulence or shear is expected. An LLJ is depicted as follows, with the wind being in the direction of the arrow and the speed shown being the maximum expected wind speed:

In general, LLJs are not included if they are above 6 000 ft ASL, except as required over higher terrain. The height of the jet is not indicated. In many cases, there may be associated turbulence, as shown in the example below:

Once issued, a significant meteorological information (SIGMET) or AIRMET message automatically amends the current and relevant graphic area forecast (GFA). The remark (RMK) found in the national version of those messages indicates the GFA region(s) to which the SIGMET or AIRMET applies.
A correction to a graphic area forecast (GFA) is issued for the following events:
(a) The occurrence of any unforecast weather phenomena that do not require an AIRMET (i.e. they are below the AIRMET criteria threshold) or any other unforecast weather phenomena that, according to the forecaster, should be depicted in the GFA.
Widespread area of BKN or OVC cloud with height of the base between 1000 and 5000 feet AGL.
Widespread area affected by the reduction of visibility between 3 and 6SM, including the weather phenomenon causing the reduction in visibility
Widespread mean surface wind speed between 20 KT and 30 KT, or peak wind gust of 30 KT or more
(b) Forecast weather phenomena in the GFA fail to occur, in which case the weather phenomena that are no longer occurring or no longer expected to occur are removed.
(c) A significant error was made in a GFA chart. A significant error is one which, if uncorrected, would result in an erroneous interpretation of the GFA and create a potential hazard to aviation.
When reissued, the correction code “CCA” is added to the first line of the title box to indicate the first correction, “CCB” for the second, “CCC” for the third, etc.

